Puaka-James 'Height'
Published 2021/10/29
After seeing a video by Mathematics Youtuber Matt Parker I was inspired to construct my own protractor and measure the height of a building. The University of Canterbury's Central Library, Puaka-James Hight (Figure 1) with a height of 53 metres (Rubix, n.d.) was selected to be measured.
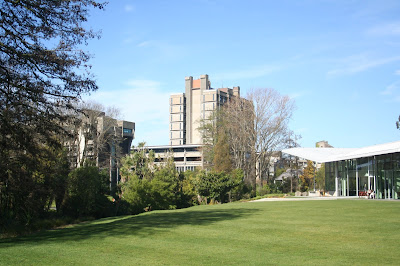 |
| Figure 1 - Puaka-James Hight (centre) as viewed from Haere-roa (left) lawn. |
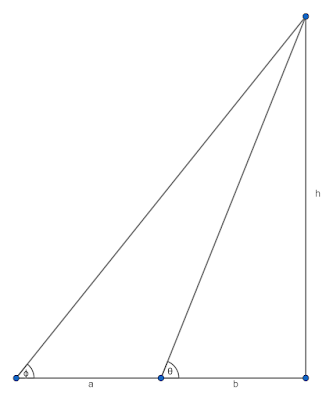 | ||
| Figure 2 - Illustration of important quantities, full explanations of these given below. |
$b$ denotes the distance from the building at the first observation site.
$\theta$ denotes the angle to the top of the building at the first observation site.
$a$ denotes the distance between the two observation sites.
$\phi$ denotes the angle to the top of the building at the second observation site.
$h$ is the height of the building.
From this we can derive a formula for $h$ without the use of $b$
$$\begin{align*}&&h&=b\tan\theta\\&&h&=(b+a)\tan\phi\\&&&=b\tan\phi + a\tan\phi\\&\Rightarrow&a\tan\phi&=b\tan\theta - b\tan\phi\\&&&= b(\tan\theta - \tan\phi)\\&\Rightarrow&b&= \frac{a\tan\phi}{\tan\theta - \tan\phi}\\&\Rightarrow&h&= \frac{a\tan\theta\tan\phi}{\tan\theta - \tan\phi}\end{align*}\tag{1}$$
In order to measure the angles involved it was necessary to construct a protractor with a plumb-line. This was done with the use of Fusion 360 and an Ender 3 3D Printer. An initial black layer was laid down to give the degree markings, and a blue body was printed on top of this (Figure 3). The protractor is accurate to a degree, this may be improved with a larger print.
| Figure 3 - The 90 degree protractor without plumbline. Loop for plumbline can be seen at top. Large radial marks are given at 15 degree intervals. |
Observations (Figure 4) were taken over 5 different sites (Figure 5). Latitude and longitude coordinate data were noted for each site using GPS. Raw data can be found in the Github Repository (Footnote 1).
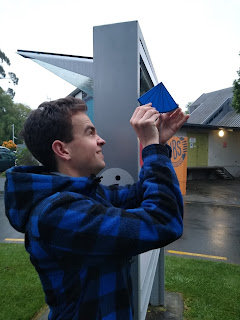 | ||||
| Figure 4 - Measuring the angle of inclination at site A1. |
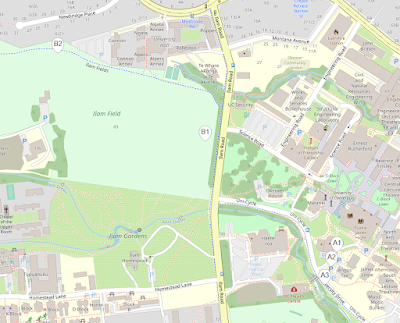 |
| Figure 5 - Observation Sites, image rendered with Folium using data © OpenStreetMapcontributors, under ODbL. |
The observations were then processed in Python (Footnote 1) using (Equation 1) giving the following results (Figure 6)
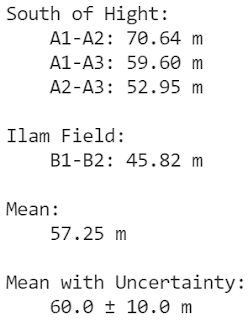 |
| Figure 6 - Results processed with Python (Footnote 1). |
The final result with uncertainty $(60 \pm 10) \text{ m}$ agrees with the expected value of $53\text{ m}$ (Rubix, n.d.). This is more accurate than anticipated.
Update (30/10/2021):
Excluding the height predicted from the observation A1-A2 yields a mean of $52.79\text{ m}$, accounting for uncertainty gives $(53.0 \pm 7.0)\text{ m}$. This agrees far more closely with the expected value. However exclusion of that data point is arbitrary choice based upon prior knowledge of the expected height, doing this is not a valid scientific choice, rather it is an interesting observation. It should also be noted that the observation A2-A3 gives almost exactly the expected height but selection of this point is also arbitrary.
Acknowledgements
Thank you to Tanya Smith for supplying and installing the protactor's plumbline, Finn Trass for supplying the plumb bob, and William Beauchamp for his assistance with measurements.
Footnotes
1. Github Repository with Data, Processing, and Mapping. https://github.com/JHay0112/HightHeight